The BIG-MAP project generates large numbers of spectra during spatial mapping, in situ and operando experiments on battery materials. In this scenario, manual pre-processing of spectra becomes error-prone and prohibitively laborious. In this article we describe the processing tools we have developed to tackle the high-throughput spectral analysis challenge. Whether by harnessing human expertise or by leveraging neural network models, these tools are accelerating the way we uncover scientific insights from spectra.
Spectra are indispensable to understand battery materials. Alongside electrochemical testing and imaging, spectroscopies are one of the main characterisation pillars in the BIG-MAP project. Spectra reveal the properties and state of battery materials at multiple spatial scales, whether these materials are studied in isolation or as part of a battery cell before, during and after cycling. Nearly all spectra consist of (electron, photon) intensity counts indexed according to a scanning variable (e.g. absorption energy). Spectra are consequently a record of the patterns that result from the interaction between the spectroscopic probe and the sample material.
Analysing spectra, the traditional way. When spectra are only a few, experts visually inspect patterns (e.g. peaks) and interpret these within the context of the sample’s known composition, properties, or instead compare to physical models of the probe-sample interaction. Spectra are typically noisy and convolved with artifacts such as outliers and drifting baselines, which complicates pattern identification. Experts generally pre-process each spectrum to facilitate the recognition of relevant patterns. However, manual pre-processing is not only prone to biases that affect reproducibility, but it is also time consuming. The BIG-MAP project generates large numbers of spectra during spectral mapping, in-situ and operando experiments, for which manual pre-processing becomes prohibitively laborious. We have therefore developed tools for high-throughput processing of spectra either by keeping the human in the loop, or by outsourcing pattern recognition to neural network models.
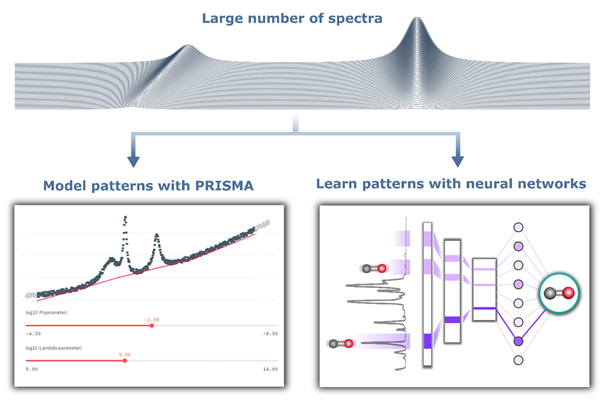
Analysing spectra at scale. The first tool - PRISMA - implements traditional spectral analysis but in a high-throughput fashion. PRISMA implements both a codebase for spectral analysis and a graphical user interface (GUI). The codebase allows for trimming, baseline correction and peak fitting with typical lineshapes, such as Gaussian, Lorentzian and Pseudo-Voight profiles. The GUI enables users to visualize in real time the effects of pre-processing routines and parameters. Hence, PRISMA operates on a human-in-the-loop model, offering intuitive control over spectral processing and delivering results in an accessible *.csv format. We have demonstrated the app's strength via several case studies reported in a peer-reviewed publication.1 PRISMA has been released open source to the service of the battery community,2 and it is currently used by multiple consortium partners and institutions across the world.
Outsourcing spectral analysis to neural networks. Alternatively, we can automate the extraction of patterns from spectra using Convolutional Neural Networks (CNN). Instead of modelling a spectrum as a set of peaks, we leave a CNN to learn spectral patterns from large amounts of data, without heuristic assumptions in an autonomous way. These neural networks have been used to classify spectra into groups (e.g. which spectra characterize a species of bacteria), and to map spectra to the value of numerical properties (e.g. quantify the concentration of a chemical from its spectrum). However, what is the network learning from the data to make predictions? Is it using peaks and their positions as spectroscopists do? Is it learning spurious artifacts? We answered such critical questions by developing a CNN that learns to classify functional groups from infrared spectra. Our model classifies most functional groups with accuracies above 95%. Once we have verified that the CNN is accurate, we use a two-step approach for explaining the network's classification process, and so assess whether it is learning patterns that carry physical information. Our findings not only demonstrate that the CNN learns the characteristic group frequencies of functional groups, but also suggest that, unlike most spectroscopist, it also uses the absence of peaks and anharmonic vibrations to make predictions.3,4 CNNs help us learn spectrum-property relations from large number of spectra. Crucially, understanding what neural networks learn from data is instrumental to assess their ability to generalize, to study how the patterns built upon existing scientific principles, and to justify critical decisions based on model predictions.
References
- Flores E, Mozhzhukhina N, Li X, Norby P, Matic A, Vegge T. PRISMA: A Robust and Intuitive Tool for High‐Throughput Processing of Chemical Spectra. Chemistry‐Methods. 2022 Oct;2(10):e202100094.
- https://github.com/BIG-MAP/PRISMA
- Rieger LH, Wilson M, Vegge T, Flores E. Understanding the patterns that neural networks learn from chemical spectra. Digital Discovery. 2023; 2; 1957-1968.
- https://github.com/laura-rieger/SpectraML-Classification